Pacific Smiles Group – A Return To Smiles
Introduction
Pacific Smiles Group(PSQ.ASX) is an Australian based dental practice operating 127 centers and employing 850 dentists as of August 2022. Pacific Smiles is consolidating the Australian dental market as the market is quite fragmented. The growth runway for the company is large as the company only has a 3% market share. Pacific Smiles had a bad fiscal year 2022 due to covid shutdowns in Australia and the stock price reflects that. The Group was run really well in the past and I expect a recovery and continued growth going forward.
Note
All $ amounts in Australian dollars
Currency
As a US investor buying Australian stocks creates currency risk. I analyzed the Australian currency back in my previous article on AF Legal(Link) and continue to hold the same view.
Market Size
There are two ways to measure the market size that Pacific is pursuing. The first is by dollar amount, the dental services market in Australia is $9.5B as of 2020. Pacific’s FY 2022 Patient fees was $226m which puts their market share at around 2-3%. The market has been growing at a healthy 3% rate from 2009 to 2019. This growth is underlined by rising disposable incomes and demand for oral health services increases as a result of a growing and aging of the population.

Source: Australian Institute of Health and Welfare
The second way is by total dentists employed. In Australia as of 2021 there were 24984 registered dental practitioners in the country. As of FY 2022 Pacific employed around 850 dentists. This would put their market share at 3.4%. The amount of dentists in the country has grown at a 2% rate since 2012.
Pacific Is the third largest dental practice in Australia behind Abano Healthcare and Bupa Dental Care . Both Abano and Bupa have over 200 centers in Australia and Pacific operates 127 centers. Besides Abano and Bupa the dental services market in Australia is quite fragmented with most companies being single center operators. There are approximately 15,000 dental service companies in Australia.
Either way you slice it Pacific’s share of the total market is small with the added benefit of being a large scale player in a fragmented market. This means that Pacific will be able to continue opening and acquiring centers for a long time. Management’s long term goal is to open 250 centers. 250 centers would give Pacific around a 6% share of the market which is still quite small. Longer term I think the Australian dental market will look like the German and Spanish eye care markets which are quite consolidated. Both the German and Spanish eye care markets have 86% and 88% percent of their market owned by the top six companies according to JB Capital. My estimate of Australia is that the top six companies own only 16% of the market. If Pacific can capture a 15% share of the Australian market that means they could have 630 centers which is close to 5 times more than they currently have. Not to mention Pacific has hinted at expanding into other areas of health which would expand their TAM even more.
Stock price
Australia has been in and out of lock downs as successive waves of covid have come and gone. The lock downs starting in November 2021 and mostly ending by Jan 2022 hampered Pacific’s operating performance for FY 2022. Revenue was down from $153m in 2021 to $139.5m in 2022. Same center sales were down 10%. Most importantly EBIT was down from $21m in 2021 to -$3.9m in 2022. The stock price reflects the fundamental deterioration in the business as the stock is down 50% since the peak in November 2021 .

Source: Tradingview
Even as Australia had an elevated covid case count in July 2022. Australian Politicians were done with lockdowns at least according to this article. With no more lockdowns Pacific should benefit. With reduced volume the business was unable to leverage their fixed cost base. As of August for their FY2023 same center patient fees have increased 28.4% hinting towards the company already seeing much higher volumes. As volume picks up, fixed cost leverage will reverse and the company should return to their previously excellent financial performance.
Financial Performance
Pre 2022 dip in performance the company had been growing quite nicely with excellent unit economics and high returns on capital.
Unit Economics
In Pacific’s 2022 investor presentation they give a hint towards their center’s unit economics. A center after start up takes 5 years to reach maturity. At maturity the center generates 2.5mm in patient fees. Patient fees are not revenue as the company shares 40% of the fee’s with the dentists. Patient fees convert to revenue at about 60%. So a mature center should have $1.5m in Revenue. EBITDA margin per center is 20% which converts to net income at around a 50% conversion ratio. This gives each center around $250K in profit. Per CEO on an interview with Equity Mates a center costs around $850K to set up. This gives the company a return per center of 29% which is quite a good rate to reinvest at.
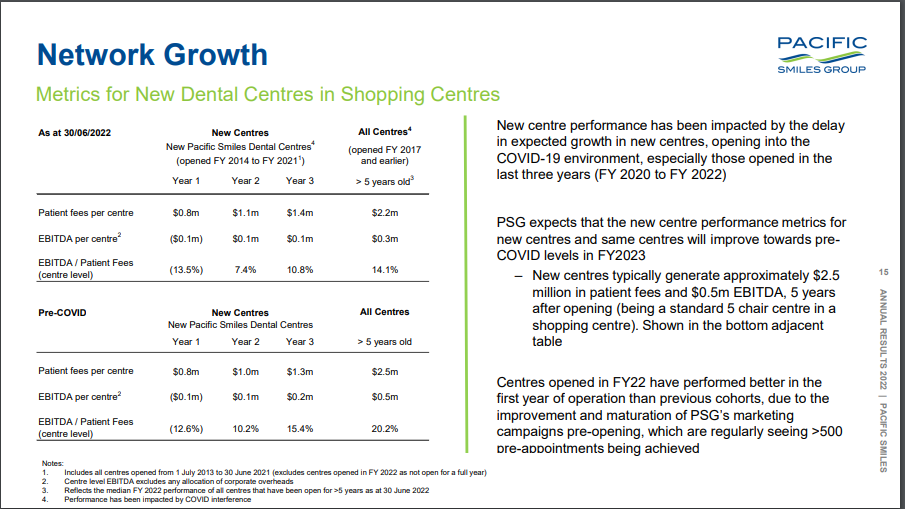
Source: Pacific Smiles 2022 Presentation
Below is a table summarizing how I got to their Unit Economics.
| Patient Fee’s | $2.5m |
| EBITDA Margins | 20% |
| Income Conversion | 50% |
| Income | $250k |
| Cost of center | $850K |
| ROC | 29% |
Growth
Pacific has grown center count from 58 in 2016 to 127 by 2022 which is a 14% CAGR. Alongside this revenue increased to $139m from $83m. In 2021 with less lockdown activity the company got to a record $153m in revenue. If revenue per center was back to a precovid average of $1.350m then revenue for the company would have been $171m in 2022. An indicator of a good business is same center sales which are sales from centers from the existing base. Precovid from 2016-2019 this averaged 5.6% which tells me increased traffic to existing locations.
| Fiscal Year | 2022 | 2021 | 2020 | 2019 | 2018 | 2017 | 2016 |
| Revenue (In Millions | 139,467 | 153,175 | 120,055 | 122,156 | 104,528 | 91,471 | 83,337 |
| Same Center Sales | -10.1% | 26% | -4.5% | 8.6% | 5.1% | 3.8% | 5% |
| Average Revenue by Center ( In thousands) | 1098.17 | 1405.28 | 1277.18 | 1372.54 | 1306.60 | 1306.73 | 1436.84 |
| Number of centers | 127 | 109 | 94 | 89 | 80 | 70 | 58 |
Management’s longer term goal as mentioned above is to get to 250 centers which implies around 1500 dentists employed by the company. If management continues to build out centers at the precovid rate they will reach this target within 5-7 years. This would double revenue and market share. Market share would still be only 5-6% which means the company would still be able to grow center count much higher.
For FY 2023 management in their 2022 presentation is projecting around $160-$170m in revenue with $12-$13m in profit. The company is also projecting to build 7 centers over the next year. Once conditions stabilize, Pacific plans to return to a roll-out rate of 10-20+ centers per year.
Profitability
In terms of profitability I prefer to use free cash flow(FCF). One flaw with FCF is that fast growing companies tend to use a lot of capex which is for growth but it hurts profitability. So instead of the usual way to calculate FCF I use operating cash flow minus depreciation. This more accurately simulates what margins will be if the company decided to stop building new centers.
Using this modified FCF figure profitability precovid averaged 10%. Due to the large number of centers being opened this depresses profitability due to sales leverage. If the company decided to stop growing, profitability could be even higher.
ROE was calculated with the modified FCF divided by equity. ROIC was calculated with FCF before interest and taxes divided by invested capital. Both metric’s are registering high returns which points to a great business. ROE averaged pre 2022 27% with ROIC at 31%. As we go into 2023 I expect profitability to return to these historical averages.
| Year | Average 2022 | 2022 | 2021 | 2020 | 2019 | 2018 | 2017 |
| FCF Margin | 10% | -5% | 12% | 7% | 9% | 9% | 12% |
| ROE | 27% | -12% | 31% | 25% | 28% | 23% | 25% |
| ROIC | 31% | -12% | 44% | 27% | 27% | 25% | 31% |
Management
The company was founded by Dr Alison Hughes and Dr Alex Alexander however both have recently retired with Alex retiring in 2020 and Alison retiring in 2022. Both remain large shareholders in the business with a combined stake of over 25%. With large insider ownership and excellent operating performance that’s enough for me to check off good management. One not so great thing is the fact that management seems to insist on the fact they should payout 70% of net income as dividends even though plowing it into centers would be a much better thing to do.
Customer and Employee Reviews
Net promoter score(NPS) which measures customer satisfaction has improved a lot since Pacific’s IPO in 2014 where they scored a 60. In 2021 the score is above 85. NPS is rather a vague measure of customer satisfaction as no one really knows how the company is calculating it. So I went to google reviews and tried to find 20 centers with the most reviews which represents a sample size of 16%. My findings were out of 1071 reviews Pacific scored a 3.8 in google reviews. 4 Stars is considered the threshold for something to be considered good so this is below that mark. However I will give the company a pass as NPS has improved dramatically over the past years so the google review score might be affected by older low star reviews. But I’ll keep a close eye on this metric for the future.
Pacific Smiles Google Reviews
| Center Locations | Rating | Number of Reviews |
| 360 Bourke St, Melbourne VIC 3000, Australia | 4.1 | 99 |
| 61 Station St, Penrith NSW 2750, Australia | 4.2 | 86 |
| Cranbourne Park, 85 High St, Cranbourne VIC 3977, Australia | 3.6 | 59 |
| Caroline Springs Square, 29 Lake St, Caroline Springs VIC 3023, Australia | 3.9 | 56 |
| 555 High St, Melton West VIC 3337, Australia | 3.3 | 45 |
| Stockland Point Cook, Cnr Main and, Murnong St, Point Cook VIC 3030, Australia | 3.6 | 55 |
| 1/442 Nepean Hwy, Chelsea VIC 3196, Australia | 4.6 | 86 |
| The Galeries, Level 1/500 George St, Sydney NSW 2000, Australia | 3.8 | 68 |
| Marrickville Metro, 2930/34 Victoria Rd, Marrickville NSW 2204, Australia | 3.9 | 50 |
| Shop 1049/0 Westfield, 1 N Lakes Dr, North Lakes QLD 4509, Australia | 3.3 | 46 |
| 18 Benjamin Way, Belconnen ACT 2617, Australia | 3.6 | 40 |
| Westfield Plenty Valley, 415 McDonalds Rd, Mill Park VIC 3082, Australia | 3.6 | 35 |
| Eastland, 1, 175 Maroondah Hwy, Ringwood VIC 3134, Australia | 3.7 | 40 |
| Westfield Warringah Mall, Old Pittwater Rd, Brookvale NSW 2100, Australia | 4.3 | 39 |
| Aspley Hypermarket, 59 Albany Creek Rd, Aspley QLD 4034, Australia | 4.2 | 25 |
| Macarthur Square, 200 Gilchrist Dr, Campbelltown NSW 2560, Australia | 3.2 | 26 |
| Westfield Mt Gravatt, Cnr Logan &, Kessels Rd, Upper Mount Gravatt QLD 4122, Australia | 3.2 | 41 |
| 8 Molly Morgan Dr, East Maitland NSW 2323, Australia | 3.7 | 52 |
| Waverley Gardens Shopping Centre, 271 Police Rd, Mulgrave VIC 3171, Australia | 3.8 | 35 |
| 295 Gympie Rd, Strathpine QLD 4500, Australia | 4 | 32 |
| Average/Total | 3.8 | 1071 |
As for employees the company claims to have over 85% dentist retention and 75% employee retention as of FY 2022. Australia’s largest job site is Seek and currently the company only has 3.2 stars. Lots of the negative reviews write about the large amount of turnover at the company. Now 3.2 stars isn’t good by any means but we need to look at it in context of the industry as it’s right in line with peers. Bupa, Maven and 1300Smiles, all competitors of Pacific, score around the same place so even though Pacific numbers aren’t great they don’t have to be because their competition also sucks.
| Company | Rating | Number of Reviews |
| Pacific Smiles Group | 3.2 | 68 |
| Bupa Dental(1) | 3.0 | 270 |
| Maven Dental Group (Owned by Abano) | 3.6 | 87 |
| 1300SMILES Limited (Owned by Abano) | 2.8 | 52 |
1: Bupa is mainly an insurance company so the reviews are not 100% comparable.
Risks
The two biggest risks I see for the company are execution and multiple contractions.
Execution
The largest risk with this company is the execution of future growth. The things that can go wrong are numerous such as employee retention problems, medical accidents that affect consumer opinion, competition, and deterioration of unit economics. Considering the company is still quite small with only 3% market share I do think those types of issues are still a way’s off.
Multiple Contraction
The company is down quite a lot since November of 2021 but it’s still not super cheap yet. The price to FCF multiple for the company is clocking in around 20 times. A 20 times multiple is a growth multiple. Using a DCF 20 times implies 5% CAGR long term growth in the business. Considering the company averaged 5% same center growth pre covid and this multiple does start to be cheap.
On average, since the company’s IPO on the high end has traded at a 30 times multiple which implies 10% growth long term which is actually more like what the company has done. At the low end the company has averaged 20 times multiple. So the current price is on the lower end historically for the company.
| Year | Avg | 2022 | 2021 | 2020 | 2019 | 2018 | 2017 | 2016 | 2015 | 2014 |
| PH/FCF | 33.11 | -66.09 | 25.84 | 43.70 | 24.84 | 28.76 | 29.79 | 45.58 | 38.44 | 27.95 |
| PL/FCF | 20.83 | -30.83 | 18.63 | 11.58 | 13.86 | 18.96 | 22.51 | 31.91 | 25.48 | 23.70 |
- PH is the highest price of of that year
- PL is the lowest price of that year
Any deterioration of Pacific growth though will lead to a lower multiple and so I include it as a risk.
Expected Return
I calculate the expected return of the investment using 3 scenarios: a base, worst, and no growth.
| No Growth Case | Worst Case | Base Case | |||
|---|---|---|---|---|---|
| Center Count 2027 | 127 | Center Count 2027 | 162 | Center Count 2027 | 200 |
| Revenue Per Center 2027 | 1.6m | Revenue Per Center 2027 | 1.2 | Revenue Per Center 2027 | 1.3 |
| Revenue Target 2027 | $203m | Revenue Target 2027 | $194m | Revenue Target 2027 | $260m |
| FCF Margin | 12% | FCF Margin | 6% | FCF Margin | 9% |
| FCF Per Share | .146 | FCF Per Share | .069 | FCF Per Share | .14 |
| Multiple | 14 | Multiple | 12 | Multiple | 20 |
| Average Div Yield | 4% | Div Yield | 3.5% | Div Yield | 3.5% |
| Expected Return | 11% | Expected Return | -7.5% | Expected Return | 17.5% |
Base Case
The company has averaged a 14% center growth per year. FY 2023 center growth per company is expected to be only 5.5%. Management in their 2021 presentation said they expect to return to higher center growth after things stabilize. I expect the company to return to faster center growth in FY 2024. Over the next five years I expect 10% center growth which will get Pacific to around 200 centers. With the different vintages of centers revenue per center should average 1.3m. In the past with revenue per center of 1.3m margins were around 9% which is what I assumed. If Pacific can execute on this growth, a 20 FCF multiple is probably the lowest multiple it would deserve as the company has gotten to 30 in the past. I assume a 20 multiple to be conservative. With a 70% payout for next year the dividend should be 3.5%. With these assumptions the 5 year return at the current share prices would be a 17.5% CAGR.
Worst Case
In the worst case scenario I assume center growth continues at the measly rate of 7 centers a year. In the worst case revenue per center doesn’t recover to an average of over 1.3m instead languishing at 1.2m. This could be due to a number of factors such as deterioration in unit economics or a much slower recovery from COVID. With the lower revenue per center margins will come under pressure due to sales leverage. I estimate this would be around 6%. That would be the lowest FCF margin in the company’s history. Due to a more than likely decreasing share price the dividend yield may actually increase however I keep it the same as the base case for simplicity. Under these conditions multiple contraction is likely as FCF growth would be flat over 5 years. So I assume a no growth multiple of around 12. In this scenario that I don’t think likely, a negative -7.5% CAGR return would materialize.
No Growth Case
In this scenario I wondered what would happen if the company decided to stop building new centers and decide to just focus on profits. A mature center over 5 years old makes $1.5m in revenue. Since the industry is growing this amount over time should increase. Since the industry has grown at 3% over time, using 3% growth for a center would get a mature center at $1.7m of revenue. I assume $1.6m to be consevative. Margin would expand under a scenario where no new clinics were built and I assume the company would get to 12%. The company has achieved that level of margin in the past even with growth and if the company was only focused on profitability a 12% margin is probably conservative. Assuming a growth rate at the same rate as the industry as a whole for the company after 2027 a multiple of 14 would be justified. The dividend yield would increase under this scenario because of multiple contraction and higher profitability. With these conditions the company’s expected return would be 11% CAGR over 5 years. This scenario provides me with the most comfort as the business doesn’t really need to grow to be able to have a good return
Conclusion
Pacific Smiles Group is trading at a low 20 times normalized FCF multiple which is on the lower end of its history. Covid lockdowns in 2022 hurt the business and also the stock price. With reopening the business should return to profitability and more importantly growth. With only a 3% share of the dental services market the company will be able to grow for a long time and with fantastic unit economics this will be very accretive to shareholders. A return to smiles.
Side Note
Because the economy is most likely going to continue to deteriorate in the short term I do wonder if I should be waiting for a more attractive multiple.
Disclosure
I am long Pacific Smiles Group at 1.46 a share.


